Turning Website Analytics Into Revenue: A Practical Guide
You’re probably collecting website analytics data. But are you actually using it to make decisions? For most businesses, the answer is no. Data gets collected, reports get generated, and then nothing changes.
The difference between businesses that grow and businesses that stagnate often comes down to one thing: acting on what the data tells you.
Forget vanity metrics like total page views or social media followers. The numbers that drive revenue are:
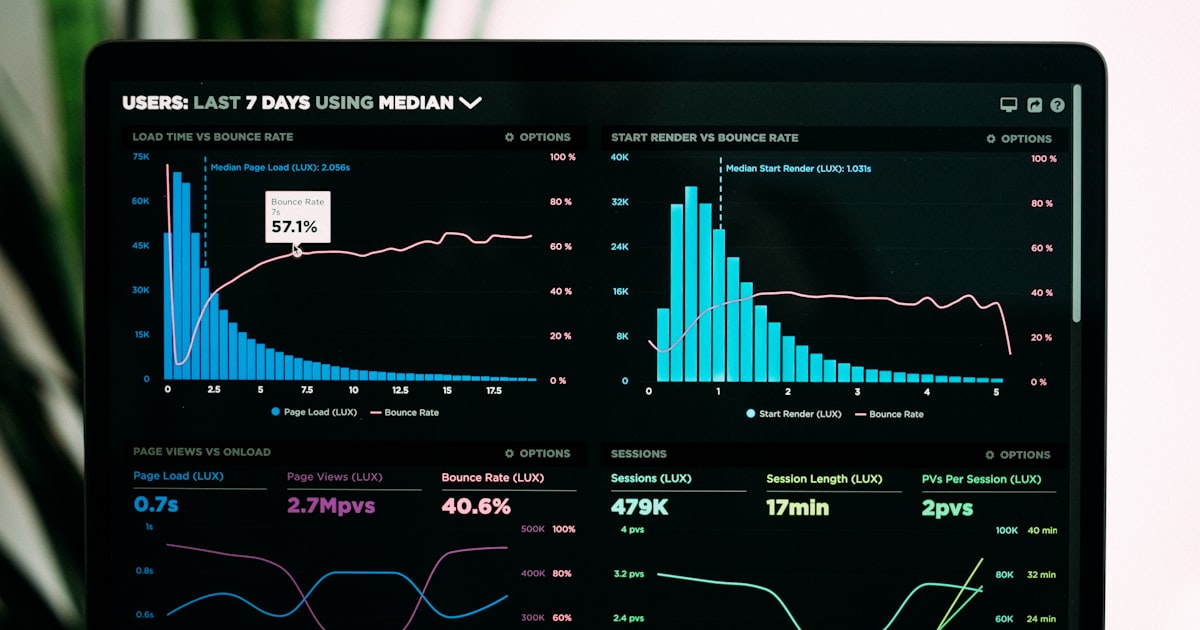
You don’t need a complex business intelligence tool. A simple Google Looker Studio dashboard that tracks your top 5-7 KPIs, updated weekly, is enough for most businesses. The key is making the data visible and reviewing it consistently.
Every metric should tie to an action. If your conversion rate from organic search drops, investigate whether rankings changed or if a landing page was modified. If your cost per acquisition from paid ads is climbing, review your targeting and ad creative.
Data without action is just noise. Start small, pick two or three metrics that directly impact revenue, and build the habit of reviewing and acting on them every week.